Scaling Live
All their faces were frozen for a few milliseconds too long. I had to check whether I was still connected to the internet. Turns out palpable excitement just comes across as connectivity issues on a Zoom call.
One face spoke up: “They’re the fastest growing creator we’ve had on the platform ever”. A wave of nods swept down the grid of camera feeds.
Another chimed in with more concern: “It’d be incredible to host their livestream. But can we handle that many people coming to the platform at once? Have we ever tried it?”
That was our first meeting about scaling new livestreaming products. Smaller creators had been using live audio for a few weeks. Live video was poised to release. We were eager to get larger creators talking and interacting with their fans in real time.
Unfortunately, eagerness alone doesn’t make hosting live events a core competency. The company had been a payments processor for a long time—certainly a demanding task—but one that can be done asynchronously in the background. Retrying a task doesn’t ruin the UX. Meanwhile, in a live event, requests are synchronous and applying backpressure means 5XX errors and a broken experience.
Fortunately though, we live in an age where competencies come packaged in a “Pro” or an “Enterprise” plan. We may not have had the accumulated technical leverage to launch live events on our own, but as with many other parts of a web application, there are vendors competing to provide technical leverage. Specifically, we found a vendor to stream audio and video to users, and update user clients with new chats.
However, despite lifting the burden of streaming all that data, our servers weren’t off the hook. The system still needed to authenticate arriving users, load data specific to them and to the event they were attending, and render the pages. The best streaming vendor in the world wouldn’t help if we couldn’t get users into the event in the first place.
So we still faced a problem: could our system support a thundering herd of users trying to get into an event? A small team of us were tasked with answering that question, and if the answer was no, trying to make it a yes within the quarter.
Asking the question
The first step to answering a question like that is to tighten it up. It’s not enough to ask “can we support this load?” — we have to specify the load in a measurable way so we can compare it with the measurements taken of our system.
So what do we need to measure?
A system responding to synchronous requests has a certain amount of capacity available. This capacity is dictated primarily by the amount of CPU and memory available, but also by logical constraints in the application. For instance, a server with 8 CPU cores provisioned to it is only bottlenecked by CPU if the logic actually allows all 8 cores to be used. If the server has a single instance of a single-threaded application running, CPU is no longer the constraint since 7 cores sit unused. But regardless of the constraint in question, the end result is that each server can only handle a certain number of requests at a time before it has to start rejecting requests.
Naturally, we don’t want our system to reject requests. If it does, users will receive errors rather than the event page they were hoping to see. Those users might not bother with the event after that, meaning a smaller turnout for the creator hosting the event. Both the user and the creator suffer, which of course means the business suffers since it relies on those two parties to make any money. So to avoid a crummy outcome, the system must have sufficient capacity to respond to requests without dropping any.
Now let’s rephrase load in light of request capacity, given that it is our fundamental, measurable constraint.
At a high level, hosting a live event requires admitting users, responding to their various actions throughout the event, and keeping them up to date with other participants’ actions. Thanks to our vendor, we didn’t need to worry about the latter two and could focus on admitting users to the event. To do that, we’d have to handle a handful of requests: rendering the page, refreshing an auth token, and registering the user with our vendor.
In a sense, we can think of a “user” as an abstraction over those initial requests, thus our task became ensuring we had capacity for that set of requests for every user who arrived. Given this idea—that a user represents a bundle of requests—it started to seem like a simple calculation: figure out how many requests are required to admit a user and then multiply that by the number of users, right? That tells us the capacity we need to have on hand.
While that’s a fine way to calculate the absolute max capacity needed, it does neglect one facet of load, and that’s time. Users aren’t going to arrive at exactly the same instant, which is what our previous calculation assumes. Instead, arrivals will likely follow some log-normal distribution, with the number of arrivals peaking around the times that notifications or invites are sent out, then tailing off after that.
As an example, here’s how user arrivals might look if we assume there are 10,000 users coming, a notification is sent just before the 2 minute mark, and the majority of users arrive within 5 minutes:
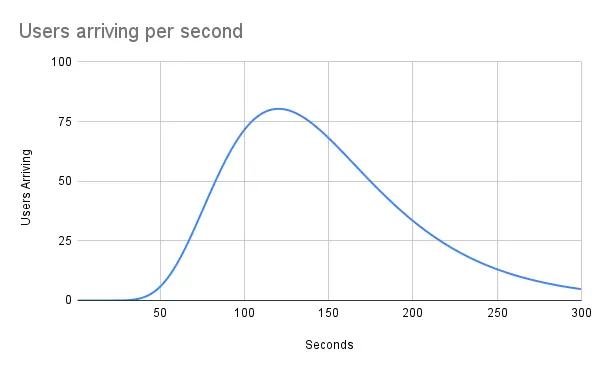
This is helpful because it shows that the max capacity needed in this example is not actually 10,000 users times the number of requests made per user. Instead, the max is actually 80 users times the number of requests made per user. This is a considerably easier problem to solve! We shed two orders of magnitude from our max capacity by spreading users out log-normally over 5 minutes.
Of course, there’s still more nuance to add. We haven’t accounted for the fact that requests don’t resolve instantaneously. They can take hundreds of milliseconds, or even full seconds, to complete. That means our max required capacity is likely higher, but it’s hard to say how much higher without latency measurements for the actual requests being made. This brings us to the next major step: get concrete numbers around user count, the anticipated arrival rate, and the latency distributions of the requests each user would be making.
Getting concrete answers required a cross-team discovery meeting, since, like good software engineers, we’d buried them under layers of abstraction.
Engineers love abstraction. We abstract away circuits of transistors and call them logic gates. We abstract away groupings of logic gates and call them devices, like a multiplexor or adder. We combine devices into components like an ALU or control unit, and then promptly forget about those and just call the whole thing a CPU. At a higher level, files combine into modules and modules create components and components make up services. These layers allow us to hold immense complexity in our heads without being overwhelmed. When the situation calls for it, we can dive into a specific layer without needing to recall all the details of the other layers.
Since abstraction lets us let go of details, it’s important to abstract the right things. If you try to hide two sets of details from each other that actually belong together, then your abstraction will slow you down. You incur cost every time you cross the abstraction boundary.
My favorite example of this is engineering teams. Do you group people around a particular system? A well-defined problem space? A particular technology? Do the teams need to move fast with full stack autonomy? Or is one layer too complex, making a horizontal team the more efficient approach? Each team layout enables certain kinds of projects by removing complexity, yet slows down others.
At my company we have a dedicated infrastructure team, frontend and backend platform teams, and a variety of cross-functional product teams. In general, product teams sit at a higher layer than the infra and platform teams, so while they can control frontend and backend logic, they tend not to interact with the lower level details of how the app is deployed and run. This places an abstraction boundary firmly between what we’re running, and how we run it, which reduces cognitive load on both sides of the boundary.
However, when it comes to scalability—that being the ability to match or exceed the capacity required of the system at any given time—this product/infra abstraction boundary is abrading. As mentioned before, capacity can be a resource issue if CPU and memory are being used up. The infra team can quickly deal with this, adding resources to servers, or adding more servers to a compute pool. But what if it’s a logic issue? Worse yet, what if you don’t know what the issue is? Context needs to be passed across each of those team boundaries, and that takes time to get right. You’re playing a game of telephone with complex ideas expressed in domain-specific language.
And so, we set up a cross-team meeting to start playing telephone. All the key parties were represented: the product team working on live events, the infrastructure team, and the platform teams. We discussed the customer journey, the pages encountered along the journey, and the requests needed to load each page. We talked about what aspects of the experience were our responsibility versus our vendor’s responsibility. We talked about how many users to expect, and how quickly they might arrive. Altogether we determined:
- There would be about 50,000 users coming.
- Most would click through a link in a notification to get to the event page.
- While we would try to space notifications out over 10 minutes to stagger user arrivals, we wanted to play it safe and assume most would arrive within 1 minute.
- About 70% of traffic would be from iOS and Android, and 30% would be web. The requests required to admit a user into the event differed between mobile and web, and we put together a list of both.
Finally, we had a well-defined version of the original “can we support the load?” question. The real question was: “do we have capacity for 15,000 sets of web requests and 35,000 sets of mobile requests log-normally distributed over 60 seconds?”.
I plotted it out to find the peak number of users who would be arriving concurrently. The peak dictates our max capacity requirement. Here’s how it looks:
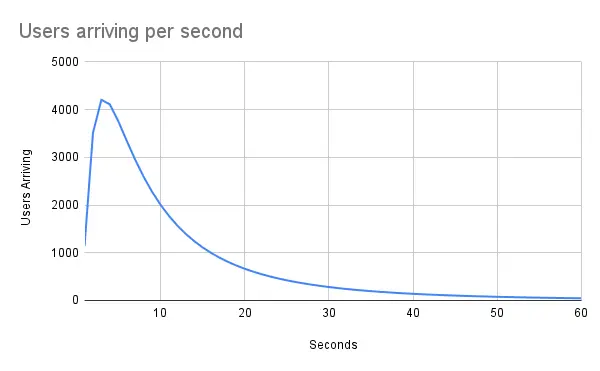
We expect most users will arrive around the time a notification is sent out, and then arrivals will tail off. The peak arrival rate is about 4200 users per second in this model.
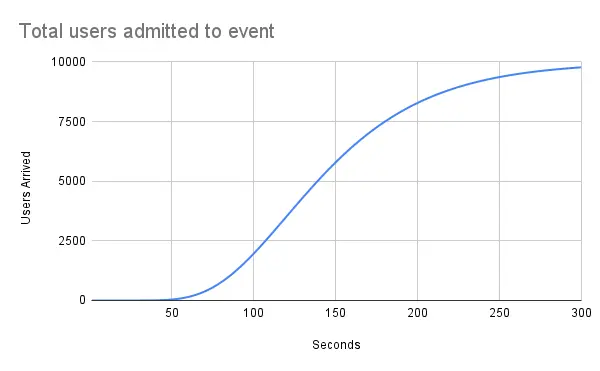
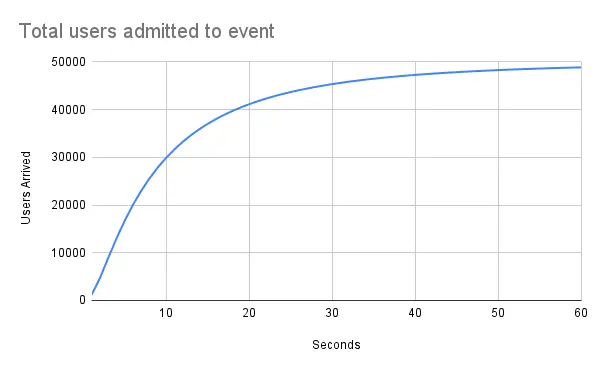
Below is the cumulative sum of users in the event as a function of time. It’s the integral of the “Users arriving per second” graph above.
With the question well-defined, we were ready to start trying to answer it.
Struggling to answer
If you think back to high school science, you probably remember the terms accurate and precise. They’re terms that describe measuring tools, where accuracy refers to how close the measurement is to reality, and precise refers to how consistent the measurements are if you take the measurement multiple times. For instance, a scale that weighs a 10 pound object at 8, 12, then 10 pounds might be considered accurate since the average is 10 pounds, but not very precise. Meanwhile, a scale that weighs it at 8 pounds every time is very precise, but not very accurate.
But what if your scale isn’t accurate or precise?
I jumped on a Zoom call with a colleague from the backend platform team to start building out a load test simulating the live event. We hoped to get an answer to our well-defined question of capacity. With a list of the requests users would be making in hand, we started to set up a scenario mimicking the “Users arriving per second” graph above. 30% of those users were hitting the web route for the live event page, and the other 70% were making the requests our mobile apps make. All users were going through our auth flow.
Before launching a full-blown test, I ran our scenario with a small amount of traffic to verify it was going to work. Right away I noticed that the traces being recorded in Datadog had durations double or triple what they normally were in production. Some requests took an order of magnitude more time than their production counterparts.
Puzzling over the poor accuracy, I figured I’d try the full scenario to verify we’d gotten the traffic pattern correct. The request count climbed toward a peak, then… stopped completely? Maybe Datadog had stopped receiving traces, or was delayed ingesting them? Maybe the client sending requests had died for some reason? I tried it again, only to see the traffic climb at half the pace it did the first time, then tail off correctly. A third attempt yielded yet another curve. Even with the same machines and the same parameters, the test was giving wildly different results. Now I was puzzled over the poor precision too!
I pored over our Terraform and our various configurations for the load test environment to figure out what was going on. The lack of accuracy was easy to find: the load test database was smaller than the production one, and many of the prod caching layers weren’t set up. A look at the database metrics also pointed out the precision problem. Load on the database fluctuated throughout the day, even when a test wasn’t running. This appeared to be due to background work that the app kicked off on its own.
From there I dug into the load test framework. The docs didn’t solve my problems, but they did reveal a new one. They explained that the framework was not made to provide absolute figures for something like requests per second, which is exactly what I was after.
In fact, the load test framework didn’t allow direct control over the request rate at all. Instead you configure users, who then make a set of requests in a defined order. This makes test writing intuitive, but also unpredictable because users only make their next request once they’ve received a response. So request rate varies with response latency. That makes the actual number of requests per second highly variable in our inaccurate load test environment, making subsequent test runs imprecise.
Armed with that information, I turned back to the load test. For various technical reasons, adjusting the database and adding in the caching layer were going to be too time consuming to be worth it, so I had to accept inaccuracy. On the bright side, all of the inaccuracy was in the same direction: all requests were taking longer than they actually would in prod. That meant that if I could get the load test environment to handle the traffic, that was an even stronger assurance that it would work in prod.
Then to try to make test results repeatable, I made a couple adjustments. I started running tests at times of day where the database load was low, and I added more clients to spread the requests out and avoid overloading the sending side. Satisfied with the improvements, I reran the scenario.
Leaning back from my screen, the tiny, chromatic graphs told me that database load hadn’t increased significantly. However, response times from the client perspective had edged up, maxing out at just over 5 seconds. The server itself wasn’t reporting many errors, but the clients were seeing almost as many 503 errors as they were successes. I mushed my forehead into my palms and tried to picture the request pathway.
If the client was seeing errors, but the server wasn’t reporting them, then that had to mean they were being dropped before reaching the server. We did have a proxy with a request queue in front of our servers. Could the requests be stuck there? I took a look at the metrics for it and confirmed my suspicion: requests were timing out of the queue after a 5 second threshold. But why were they sitting in the queue and not making it to the server?
A foray into some gnarly old Ansible suggested an answer: the server’s concurrent request capacity was embarrassingly low. Like the Lincoln Tunnel at rush hour, constriction coupled with traffic was leading to a jam.
Each server, with 8 CPU cores and 32 GB of RAM, was only running 19 instances of our app in 19 processes. Of those 19, 2 were dedicated purely to health checks, so actually only 17 were responding to requests. Further, each process handled requests serially, meaning it couldn’t accept a new request until the current one finished, even if it was blocked waiting on IO. An 8 core, 32 GB server could only handle 17 requests at once, max.
This was rather unfortunate since, at 17 requests max, we’d need 5,435 servers to handle our theoretical peak load of 4200 users arriving. Mercifully, web users only need 3 requests to get into the event. But mobile users need 30, and we expected about 70% of traffic to come from mobile. This meant that there were about 22 requests fired per user on average. 4200 users sending 22 requests, with 17 handled per server meant 5,435 servers.
Now you might be thinking, improving concurrent request capacity is a solved problem, right? Since the mid-2010s, coroutines have been first-class citizens in many languages. They allow tasks to be interleaved on the same thread with simple async/await syntax, which enables efficient use of the CPU as the runtime can pause one request during IO to work on others. It can do so even within a single thread, meaning thread count is no longer a limiting factor for the number of in-flight requests your app can have at once.
Thanks to these changes, concurrent capacity (in IO bound environments) has increased by orders of magnitude across languages and ecosystems. Node.js with its event loop can interleave and work on north of 10k requests at once. And Actix Web, a Rust web framework, defaults to 25k connections per core using coroutines. That’s not to say that the dependencies (like the database) of that server will be able to handle all those requests. But the point is, even if the bottleneck now lies on the dependencies internal to the service, we live in a world where a single Rust server with 8 cores can theoretically service 200,000 requests at once. Meanwhile our servers were configured to service 17.
Without improvements, we were going to have to increase our fleet size by an order of magnitude and then some. Granted, this still assumed that all requests were coming in instantaneously, and that they had to all be handled within a second before the next instantaneous burst of requests arrived.
In reality, many requests could resolve in less than a second, and we also could fall back on the proxy queue to buffer requests for up to 5 seconds. So we likely didn’t need a full 5000+ servers running. But it was still patently obvious from the load test that we didn’t have enough capacity, and we had to make some weighty decisions about how to increase it.
It was time to chat about options with the team.
Duct tape
One thing was becoming increasingly clear during our chat: we were going to have to focus on the performance of the application itself, as opposed to application-agnostic scalability measures.
It’s easy to confuse performance with scalability. They are related attributes of a system, but they don’t need to go hand in hand. You could have a scalable system that runs like a potato, or a blazingly performant app that can only ever handle one request at a time.
At its core, scaling is all about throwing more compute at a set of operations. This is why the industry has moved to stateless, containerized web applications—we want to be able to spin up the same code across as many CPUs as possible, and balance requests across all of it.
Meanwhile, improving performance is all about throwing fewer operations at your compute. For instance, why are many Python libraries written in C under the hood? Because by dumping the interpreter and dynamic typing overhead, you can get the same functionality for a fraction of the CPU cycles, and therefore a fraction of the time.
The two work together though. If scalability is about having capacity for necessary operations, and performance is about reducing the operations necessary, then it’s fair to say that a performant system will scale better. The “slope” is smaller in a performant system. So your best bet is to focus on performance if your architecture limits your scalability.
In our case, our architecture proved to be a cascade of limits. Handling requests concurrently within a process was out of the question, due to an outdated framework and mutable, global state. So we either needed more servers, or more app instances per server running in their own process. A little more testing revealed we wouldn’t be able to squeeze more app instances into a server without increasing the provisioned memory, since we weren’t garbage collecting thanks to the devastating effect it has on performance. But increasing memory per server also wasn’t an option since it would cause us to binpack less efficiently and therefore spend more money on idle compute. So we probably just needed to add more servers.
However, each new server posed a threat to our dependencies and deploy process. One more server meant 19 more app instances, which meant 19 new connections to the database, to Redis, and to other dependencies. And to add insult to injury, the app only had one database and one caching cluster, so all writes needed to go to the same primary instances. They could only handle so many connections before tapping out.
Even before this project started we’d seen issues during deployments. Too many new connections were created at once—and too many existing connections were still open thanks to our blue/green deployment style—and it would cause errors. The solution had been to slow down deployments. Adding more app instances was going to exacerbate the problem and force us to slow down more.
After some back and forth, we decided to increase the max number of servers by 75. We traded off between adding capacity and increasing deploy time, and figured we could settle for a small increase in deploy time. Plus, if the servers weren’t actively being used during a deploy, we wouldn’t take the hit on deploy time anyway. It’d only be if we were actively scaled up. However, adding 75 still wasn’t quite the projected 5,435 servers.
Stymied by our system architecture, we had no choice but to turn to performance. Thanks to our regular cross-team meetings, there were some angles of approach already mapped out, and colleagues ready to make it happen.
Web duct tape
The first place we optimized was the chat page, which was the entry point to a live event for web users. After rendering, our vendor was able to take over streaming operations, but that initial render sat squarely on our services. Since every web user passed through the page, it was paramount that it render as quickly as possible to free up server capacity.
One of our experienced web performance engineers tackled speeding up this page. He started by analyzing performance data for the page in Datadog. It had been running in production for some time, so there was ample trace data to look back on. He looked at the slowest traces and noticed a pattern: the slowest renders were over-fetching “bootstrap” data (data common to all pages we want to render).
He took a look at the bootstrap data to see what parts were relevant to the chats page. As frequently happens when dependencies are over-generalized, there was much in there that wasn’t relevant to the chats page at all. He added a few simple flags to the bootstrap code to selectively disable default fields, allowing the app to skip database queries and ultimately serialize a smaller payload. He turned the flags off just for the chats page, keeping our risk of bugs on other pages low.
Over a couple of iterations he took P50 latencies from ~380ms down to ~190ms (about a 50% improvement), and P90 latencies from ~700ms to ~300ms (a 57% improvement).
Mobile duct tape
The next major set of optimizations had to happen on our mobile applications. We expected most users would enter the app through a push notification and that it would be a cold launch, meaning the app would make around 30 requests to fetch all the data it needed. We had to get that number down.
Reducing request count would be tricky, since it meant less information to populate the UI. The team agreed on a 2 pronged approach: a quick, naive implementation that simply shut off all non-essential requests for the short term, and a more sustainable app launch system that ranked and executed requests by priority for the long term.
For the naive implementation, we were able to turn off much of the preloading the app was doing. Modern apps with a tab navigation preload data in the other tabs to make navigation snappy. So if you launch the app in the home tab, it’ll also load the others eagerly at the same time. When you navigate into a different tab from home the page is ready to go. But since we were in a pinch, and a fully-degraded experience seemed worse than simply a slow one, we opted to stop preloading the other tabs. We’d load the chat room needed for the live event and that was it.
For the longer term approach, we took a look at delaying non-essential requests, rather than outright abandoning them. The highest priority requests were the ones needed to load the initial screens and had to be made immediately. But requests for data for adjacent screens, or supplementary content like notification counts, could be delayed until after the initial screen was rendered. We implemented a queue to make these requests over time and spread the load out on the backend.
Altogether we were able to take the mobile app from 30 requests on launch down to 16.
In hindsight
As the quarter drew to a close, I looked back and realized we’d accomplished nothing of lasting significance. With the performance improvements we could admit 1200 users per second fully scaled up—a far cry from the 4200 we needed—but leadership decided that was fine because we could bank on users arriving slower than I’d modeled. I was pleased with the model at least, since we didn’t have a good grasp of our capacity or throughput per sever before. However, after a full quarter, our system architecture remained unchanged and still scaled remarkably poorly.
This work took place about a year ago and I wrote the initial draft of this article maybe three quarters ago. Since then the entry point for live events has changed. It’s no longer the chats page, and many of the requests being made to our backend now are different. All the work to optimize chat page rendering and reduce request count made for a nicer chats experience, but was wasted effort as far as live events are concerned.
How did it go so wrong? The core issue is our company is structured poorly. By separating the product and foundations teams, we separate what code is running from how it’s being run. That makes it very hard to build independently deployable and scalable components, since each side wants to simplify to the interface of the other. The infra team created infra to run one code blob, and the product teams wrote one code blob to run on the provided infra. Teams are not empowered to provision the infrastructure they need for themselves, and so it’s always easier to shove new code into the existing blob than it is to throw a ticket over the wall to the infra team. This is the homomorphic force—the tendency of a system to mirror the system it’s being built in—in action.
Could the existing structure work better? Sure. Many companies have foundations teams. But rather than provisioning infrastructure directly, well-used foundations teams provide tools and libraries for product teams to use, like building blocks. Or they provide APIs to the platforms they’re building. They also help route alerts and pages to the appropriate product teams, to bring reliability and scalability concerns to the folks building the product. When combined, that gives teams both the autonomy and the accountability needed to create reliable, scalable, and delightful products.
But as it stands, there is no autonomy or accountability, and there is wildly diffuse ownership since the whole product is one big blob. Who should work to improve the concurrent request capacity of our servers? Is that a foundations issue since those are the teams forced to throw more servers at the problem? Or is it a product issue since those are the teams that actually work on the application code receiving requests? Even if we could decide who should own it and do it, the changes affect the whole company since the whole company relies on the same server config. The risk and the potential for regressions is enormous. Who tests all the nooks and crannies of the app? Who signs off on it? Trying to make change without true ownership dooms you to do a quarter of work and produce no lasting results.
This is the second time I’ve had to deal with a web app receiving thundering herds of traffic. The first time my team had full autonomy and authority to change the app how we wanted. It was its own service, and not part of a monolith shared with the rest of the company, so our changes didn’t put other teams at risk. Importantly, other teams didn’t hinder us with their bureaucracy. We were solely responsible for making it happen, with support and guidance available from principal engineers if needed. We weren’t saddled by gigantic shared dependencies, like a single database or cache cluster. We could deploy independently.
That scalability work went incredibly: we were able to handle 100k+ users arriving to an event without any hiccups. We were running 5 8-core Rust servers for the backend API, 1 4-core Rust worker to handle background tasks, and were hosting the frontend server-free with S3 and a CDN. That was a full architectural refactor that has persisted past my time at the company. This scalability work, meanwhile, still struggles to handle half that traffic and requires 100x as many 8-core servers. That’s not even counting the servers handling background tasks!
I don’t think the major difference in outcomes is a coincidence. One company decoupled its applications and gave teams the autonomy and authority needed to be fully accountable to their goals and targets. The other company has a monolith and can’t articulate specific goals, other than variations on “don’t break the code”. As a result, solutions are prescriptive and principals micromanage implementation details, leaving little time to come up with a strategy out of the mire.
I am optimistic though. This project was one of the first major pain points that a significant cross section of the engineering department had to deal with that stemmed from the way we work and write code. The company is coming a place where it knows it needs to address these problems to keep scaling and growing the way it hopes to. To keep scaling with our traffic, we need to learn how to scale with our codebase, our number of products, and our engineering headcount. I’m hopeful our next scalability project will be less about engineering a scalable application, and more about engineering a scalable organization.